AlSaif Gallery:
Annual Report
2025: Margins Recover, Governance Warrants Scrutiny
AlSaif Gallery is one of the Saudi market's quieter stories — a household goods retailer with 73 branches across five GCC countries, steady revenue, and improving margins. But its 2025 annual report reveals a pattern of related-party transactions that deserve a closer look.
What Does AlSaif Gallery Do?
Al Saif Stores for Development and Investment Co., known commercially as AlSaif Gallery (Tadawul: 4192), is a Saudi joint-stock company that imports and sells kitchenware, small appliances, and household goods. Think of it as a specialty retailer focused on what goes on your kitchen counter and dining table.
The company operates 73 branches across Saudi Arabia, the UAE, Kuwait, Oman, and Qatar. Saudi Arabia accounts for about 92% of revenue; the remaining 8% comes from the GCC subsidiaries. The business is family-controlled, with the Al-Saif family holding a significant stake through direct ownership and related entities.
AlSaif Gallery listed on Tadawul in 2022 via an IPO. With 350 million shares outstanding and a relatively small market cap, it remains one of the lesser-covered names in the consumer discretionary sector.
Revenue & Earnings
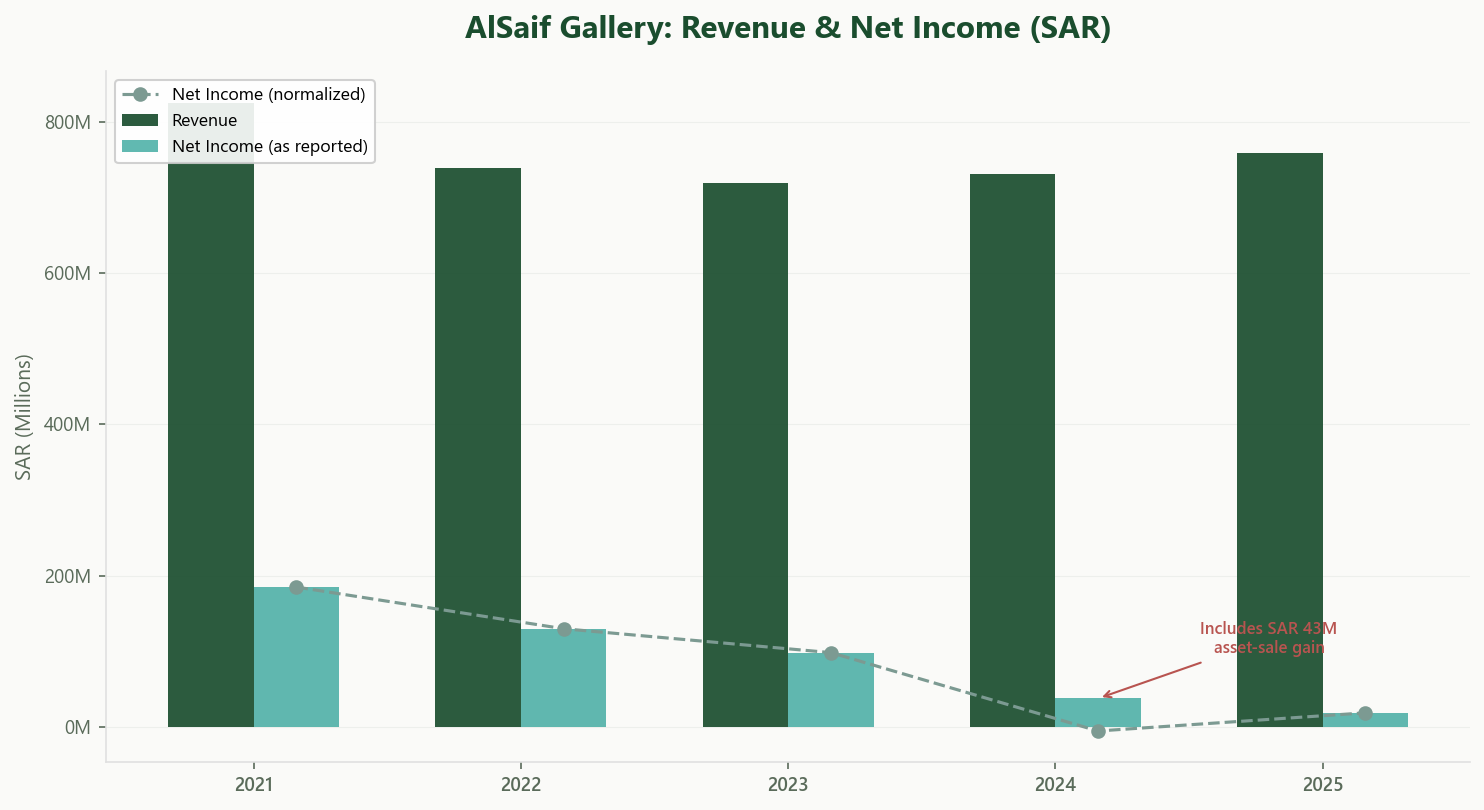
Revenue has grown modestly: SAR 720 million in 2023, SAR 732 million in 2024, and SAR 759 million in 2025, a compound annual growth rate of roughly 2.7%.
The earnings line tells a very different story.
In 2023, AlSaif Gallery reported net income of SAR 98 million and EBIT of SAR 94 million. But in 2024, EBIT collapsed to just SAR 13 million, even though revenue grew slightly.
The reason: the company sold land and a building (book value SAR 54 million) to the Chairman of the board for SAR 97 million, booking a SAR 43 million gain. That one-off gain was the single largest contributor to 2024 net income. Strip out the gain, and 2024 would have posted an operating loss.
In 2025, EBIT recovered to SAR 70 million and net income reached SAR 58 million, driven by improved gross margins and better cost control. A healthier result, but still below 2023 levels.
Profitability
Despite the earnings volatility, capital efficiency is solid. Five-year average ROIC stands at 13.5%, against a WACC in the 6 to 8% range for this profile. A consistent spread of 5 to 7 percentage points.
Operating margins recovered to 9.3% in 2025. Net Operating Profit After Tax (NOPAT) reached SAR 61 million.
The capital-light model helps: all 73 branches are leased, not owned. Worth noting, however, that SAR 12 million of those lease payments go directly to the Chairman, with another SAR 2.4 million paid to Nawa Real Estate Investment Company (also Chairman-linked) for property management. These related-party lease costs represent a meaningful portion of the company's total rental expense.
Cash Flow & Balance Sheet
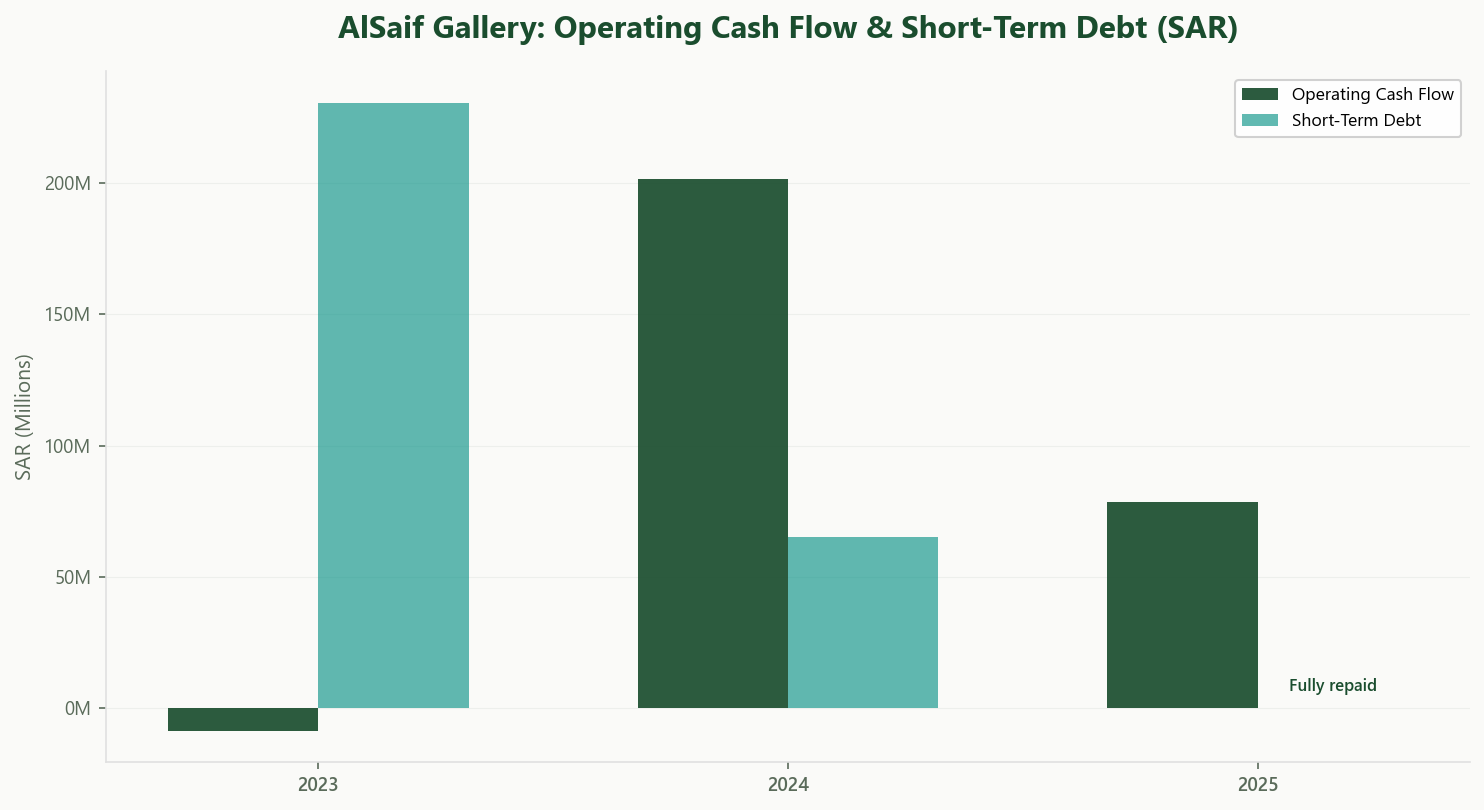
Operating cash flow swung from SAR −9 million in 2023 to SAR 202 million in 2024, then settled at SAR 79 million in 2025.
The 2024 surge was largely driven by a massive inventory drawdown: inventory dropped from SAR 410 million to SAR 283 million, releasing over SAR 125 million in working capital.
In 2025, inventory rebuilt to SAR 356 million, still 45% of total assets. On the procurement side, SAR 12 million in goods were sourced from entities related to board members, primarily Seif Plus Company. Small relative to total COGS, but an ongoing relationship to watch.
Short-term borrowings fell from SAR 231 million in 2023 to zero by year-end 2025. The remaining obligations are lease liabilities of SAR 199 million and SAR 13 million in employee terminal benefits. The bank facilities that did exist were secured by personal guarantees from certain shareholders.
Cash on hand at year-end 2025 was SAR 26 million. Modest, but the elimination of bank debt entirely is a positive signal.
Valuation & What It Implies
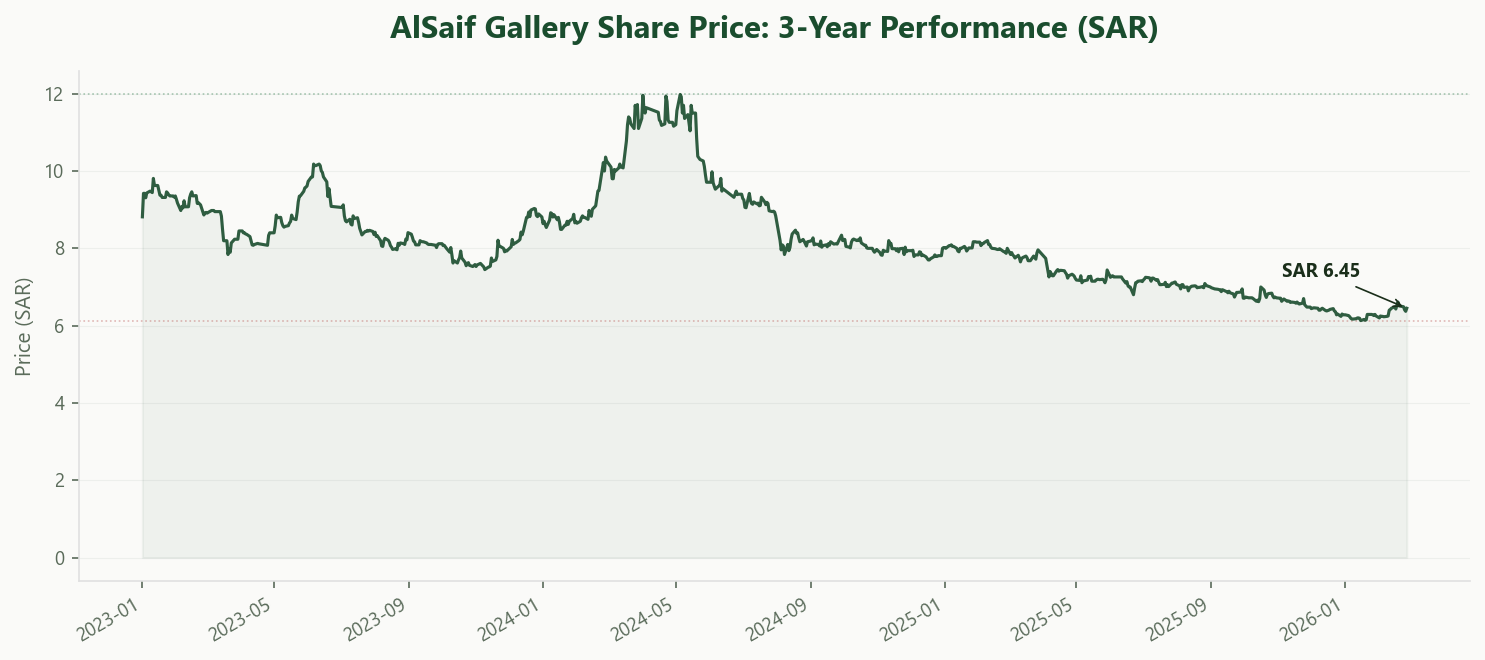
At the current share price of SAR 6.45:
On a normalized basis, after stripping out the non-recurring gains (primarily the 2024 asset sale to the Chairman), trailing net income is approximately SAR 18.5 million. That puts the P/E at roughly 122x. Even on reported 2025 net income of SAR 58 million, the P/E is about 39x. On the stronger 2023 result of SAR 98 million, it drops to 23x. The valuation depends heavily on which earnings base you consider representative.
At the enterprise level, adding SAR 199 million in lease liabilities and netting out SAR 26 million in cash gives an enterprise value of approximately SAR 2.43 billion. Against EBITDA of SAR 82 million, that implies an EV/EBITDA of roughly 29x. Expensive for a retailer with volatile earnings and single-digit revenue growth.
AlSaif Gallery has not paid a dividend since its 2023 payout of SAR 140 million (SAR 0.40 per share). In 2024 and 2025, there were no distributions. For a company with no earnings growth and no dividend, the total return proposition rests entirely on multiple expansion or an earnings recovery.
The bull case would require margins to continue recovering toward 2023 levels, inventory to stabilize, and perhaps a resumption of dividends. The bear case is that 2023 was the peak, 2024 showed how fragile the earnings base can be, and 2025 is a partial recovery that the current price already reflects.
Takeaway
AlSaif Gallery's core business is in reasonable shape. Revenue is steady, margins have recovered, and the company has eliminated its bank debt.
The pattern of related-party transactions with the Chairman is worth monitoring: the 2024 asset sale, ongoing lease payments, procurement through affiliated entities, and personal guarantees on the company's former bank debt. Collectively, they paint a picture of a corporate structure still closely intertwined with the controlling family.
Explore AlSaif Gallery's Full Profile
Usool Research tracks AlSaif Gallery's financials, governance disclosures, valuation metrics, and more — structured and updated from every filing. See the full picture for yourself.
Sign up free and explore the data.
Start Exploring →Look for value. Cut through the noise.
Disclaimer: This article is for informational and educational purposes only. It does not constitute investment advice, a recommendation, or a solicitation to buy or sell any securities. The author and Usool Research may hold positions in securities discussed. Usool Research is not a licensed investment advisor. All data sourced from publicly available filings and the Usool Research platform.