Jarir Marketing:
Revenue
Grows, Margins Stay Put
Jarir Marketing is one of the most recognized retail brands in Saudi Arabia. Revenue has climbed 16% over five years, yet net income has barely moved. A closer look at a business that keeps growing its top line while its bottom line refuses to follow.
What Does Jarir Do?
Jarir Marketing Company (Tadawul: 4190) is a Saudi joint-stock company that operates the largest chain of bookstores, office supplies, electronics, and educational products in the Kingdom.
The company operates over 70 showrooms across Saudi Arabia plus a growing presence in the GCC. The Al Agil family controls the company through a majority stake. Jarir listed on Tadawul in the early 2000s and did a 10-for-1 stock split in 2022, bringing shares outstanding to 1.2 billion.
What makes Jarir distinctive is the product mix: roughly two-thirds of revenue comes from electronics and smartphones, with the remainder split between office supplies, books, and educational products. It's a consumer discretionary business with meaningful exposure to technology product cycles and consumer spending patterns.
Revenue & Earnings: The Flat-Profit Puzzle
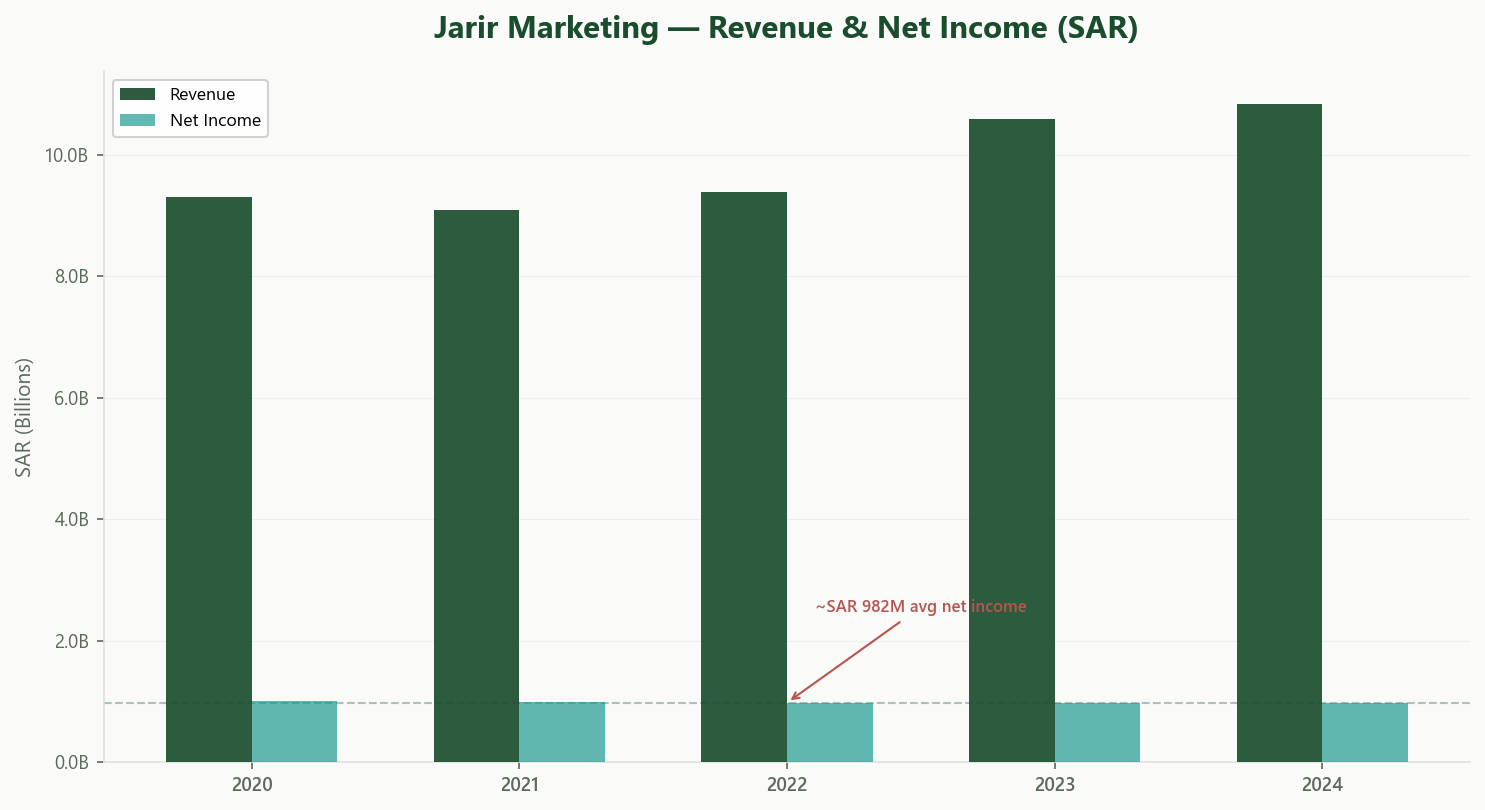
Revenue has grown from SAR 9.3 billion in 2020 to SAR 10.8 billion in 2024, a compound annual growth rate of roughly 3.1%. Not explosive, but steady.
The net income line, however, tells a very different story.
In 2020, Jarir earned SAR 1.0 billion in net income. In 2024, it earned SAR 974 million. Five years of revenue growth, and profits have gone essentially nowhere.
What is absorbing the incremental revenue? Operating costs. EBIT has hovered between SAR 1.0 and 1.1 billion for five straight years. The operating margin has compressed from about 11.8% in 2020 to 9.7% in 2024. Jarir is selling more but keeping less of each riyal.
This is not a crisis. SAR 974 million in net income is a strong result for a retailer. But investors looking for earnings growth here are not finding it. The revenue gains are being offset by rising costs, likely tied to new store openings, higher lease expenses, and the inherent margin pressure in consumer electronics.
Profitability & Value Creation
Despite the flat earnings, Jarir's capital efficiency is exceptional.
Return on Invested Capital (ROIC) stands at approximately 41%, against an estimated WACC in the 7 to 9% range. That is a value creation spread of over 30 percentage points. Few companies on the Saudi exchange come close.
How is that possible with flat profits? The capital-light model. Jarir's invested capital (equity plus debt minus cash) sits around SAR 2.5 billion. The company generates over SAR 1 billion in NOPAT on that relatively small base. All showrooms are leased, not owned. Inventory turns are reasonable for a retailer of this size.
One item worth noting on the capex side: SAR 18.7 million in construction services during H1 2025 were performed by an entity linked to the Board of Directors, with another SAR 25.4 million in capital commitments outstanding to the same party. The company states there were no special terms compared to unrelated parties. Small relative to total capex, but an ongoing relationship to monitor.
Operating margins, while compressing, remain healthy at 9.7%. EBITDA of SAR 1.23 billion gives roughly 11.4% EBITDA margin. For a brick-and-mortar retailer competing against online channels, these are solid numbers.
Cash Flow & Dividends
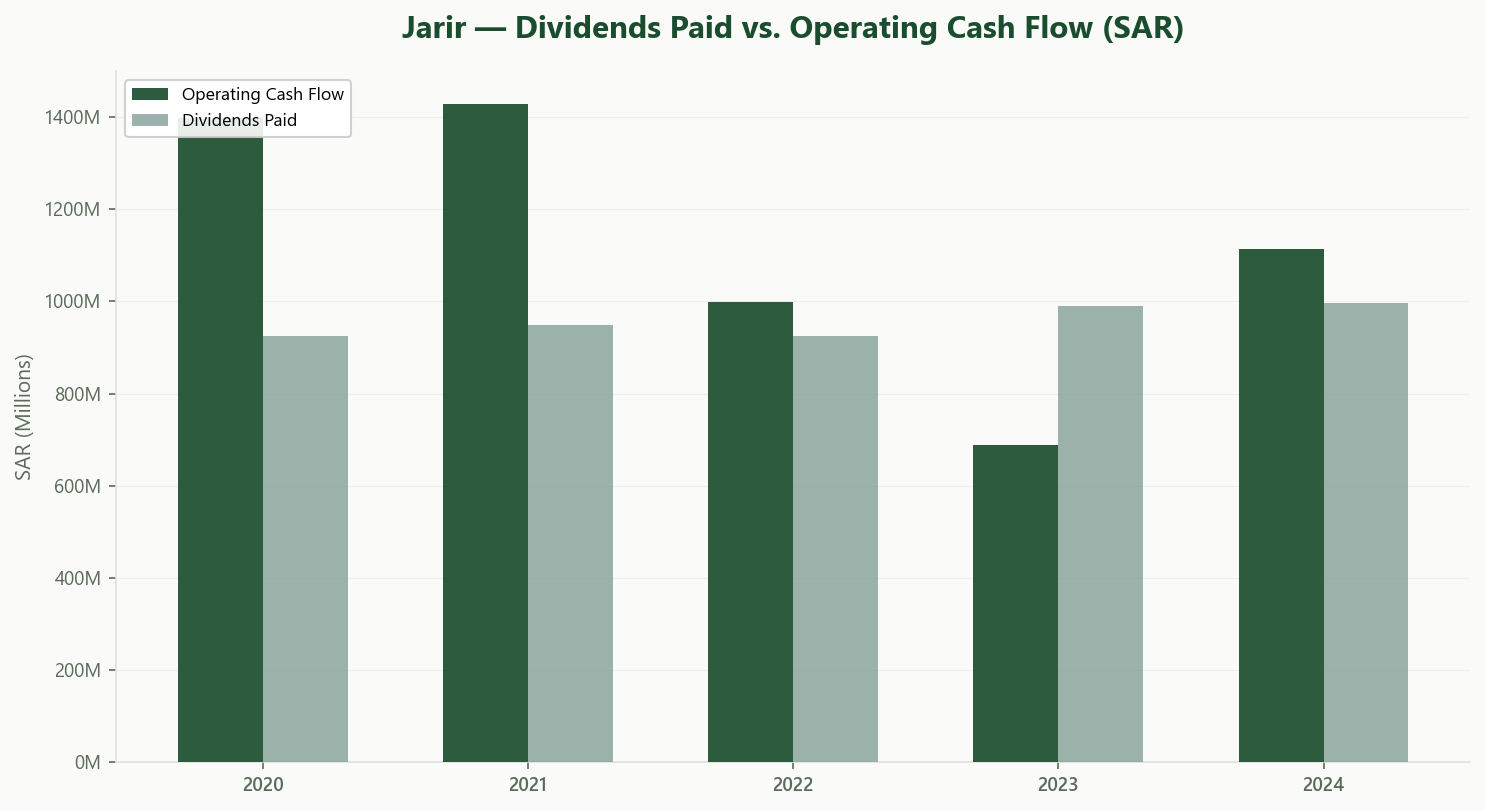
Operating cash flow has been volatile: SAR 1.4 billion in 2020–2021, then a sharp drop to SAR 689 million in 2023, before recovering to SAR 1.1 billion in 2024.
The 2023 dip was driven by inventory. Jarir built up SAR 1.65 billion in stock that year, consuming working capital and depressing cash flow. By 2024, inventory rose further to SAR 1.82 billion (roughly 42% of total assets), but payables also grew, stabilizing the working capital cycle.
Dividends tell the clearest story about management's priorities. Over the past five years, Jarir has paid out roughly 100% of net income as dividends. In 2024, dividends of SAR 996 million against net income of SAR 974 million meant the payout ratio slightly exceeded earnings.
At the current share price, the dividend yield is approximately 5.9%. Jarir has paid SAR 0.83 per share annually in recent years, and the consistency is notable. But there is essentially no retained earnings buffer: what the company makes, the company pays out. That practice has, incidentally, triggered a multi-year dispute with ZATCA over whether dividends exceeding retained earnings are deductible from the zakat base. The amounts involved were small and fully provisioned.
Short-term borrowings remain minimal at SAR 40 million. The main liability is lease obligations of SAR 752 million (current and non-current combined). Cash on hand at year-end was SAR 33 million. Not much of a cushion.
Valuation & What It Implies
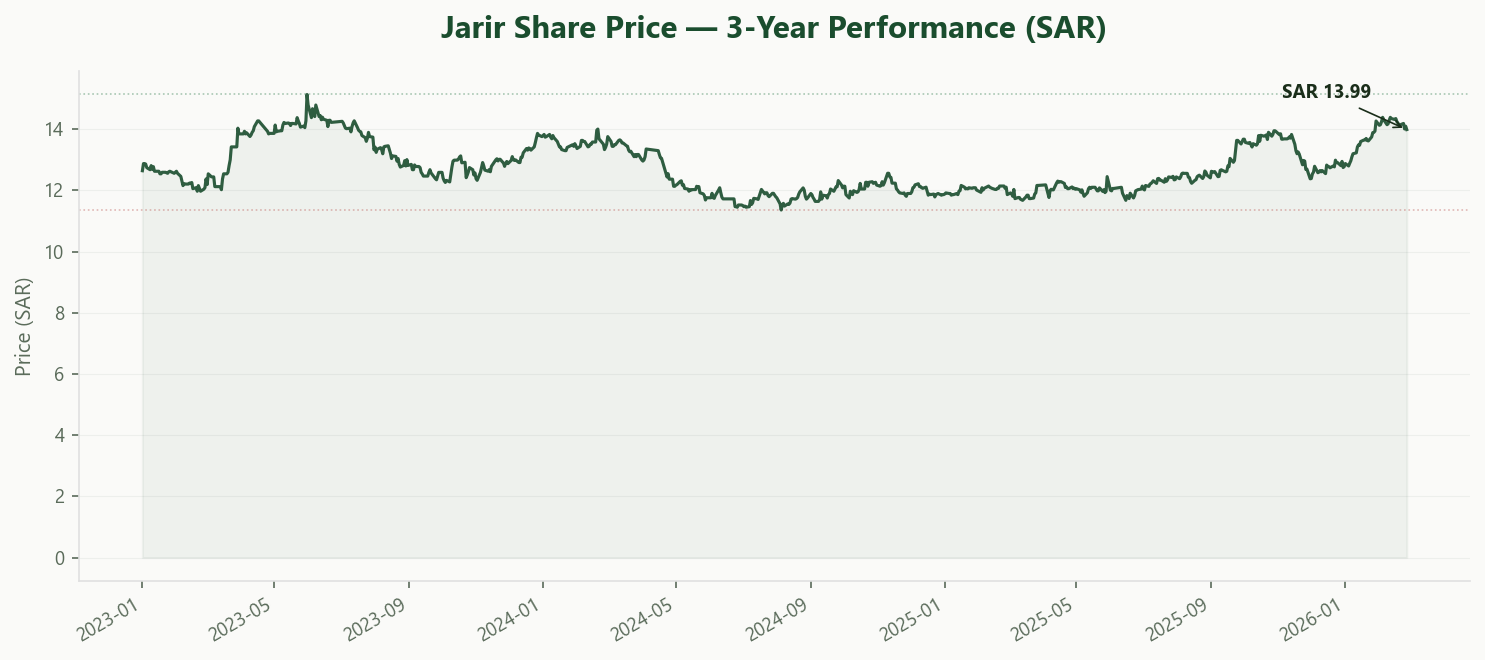
At the current share price of SAR 13.99:
Start with the P/E. At 17.2x trailing earnings, Jarir trades at a meaningful premium to what you'd expect for a retailer delivering zero earnings growth. A flat-growth business paying out 100% of earnings is essentially a bond substitute. If earnings don't grow, the only return is the dividend. At 5.9%, that's decent by Saudi standards, but it prices in no growth premium whatsoever.
Compare that 17.2x P/E to what it buys you. Over the past five years, earnings per share have been essentially flat at SAR 0.81. Revenue has grown, but none of that growth has translated into higher profits per share. The PEG ratio, in effect, is infinite: you're paying a growth multiple for a no-growth earnings stream.
The dividend itself is well-covered by operating cash flow in most years (SAR 1.1 billion OCF vs. SAR 996 million dividends in 2024). But in 2023, OCF dropped to SAR 689 million while dividends stayed at SAR 990 million. The company dipped into its cash reserves to maintain the payout. With only SAR 33 million in cash at year-end 2024, there's very little buffer if another inventory-heavy year compresses cash flow again.
The market cap of roughly SAR 16.8 billion also implies an EV/EBITDA of about 14.3x (adding SAR 752 million in lease liabilities and netting out minimal cash). That's rich for a mature retailer in the consumer discretionary space.
The bull case is simple: Jarir is a well-known brand with exceptional capital efficiency and a reliable dividend. The bear case is equally straightforward: you're paying 17x for a business whose profits haven't moved in five years, whose dividend consumes every riyal of earnings, and whose margin trajectory is heading in the wrong direction.
Takeaway
Jarir Marketing is a well-run business with exceptional capital efficiency. A 41% ROIC, conservative leverage, and a nearly three-decade track record on Tadawul are genuine strengths.
The challenge is growth. Revenue keeps climbing, but margins keep compressing, leaving net income stuck in a narrow band for five years. Inventory is rising. The dividend payout leaves no earnings retention for reinvestment. The related-party construction costs are disclosed and individually modest, but they fit the broader pattern of a family-controlled business that channels nearly every riyal of profit out the door.
Whether this is a mature business returning capital efficiently or a company that is slowly running out of room to grow depends on what happens next with margins and new store economics.
Explore Jarir's Full Profile
Usool Research tracks Jarir's financials, governance disclosures, valuation metrics, and more — structured and updated from every filing. See the full picture for yourself.
Sign up free and explore the data.
Start Exploring →Look for value. Cut through the noise.
Disclaimer: This article is for informational and educational purposes only. It does not constitute investment advice, a recommendation, or a solicitation to buy or sell any securities. The author and Usool Research may hold positions in securities discussed. Usool Research is not a licensed investment advisor. All data sourced from publicly available filings and the Usool Research platform.