Leejam Sports Annual Report 2025:
Revenue
Doubles, Profits Hit a Wall
Leejam Sports operates Fitness Time, the largest gym chain in Saudi Arabia. Revenue has nearly doubled since 2021, but 2025 net income dropped 34%. A closer look at the expansion engine, the cost of growth, and the leverage behind it.
What Does Leejam Do?
Leejam Sports Company (Tadawul: 1830) is a Saudi joint-stock company that operates the largest chain of fitness centers in the Kingdom under the "Fitness Time" brand. The business includes male and female gyms, personal training, and retail sales of sportswear and equipment.
The company operates across Saudi Arabia and the UAE, with Saudi operations accounting for 97% of revenue. Male centers generate SAR 1.17 billion (73% of total revenue) while female centers contribute SAR 424 million (26%). Revenue comes primarily from membership subscriptions and personal training services.
Leejam listed on Tadawul in 2018. The company has been in aggressive expansion mode, rapidly adding new centers across the Kingdom and acquiring niche subsidiaries. Total assets have grown from SAR 2.6 billion in 2021 to SAR 4.0 billion in 2025.
Revenue & Earnings: Growth With a Catch
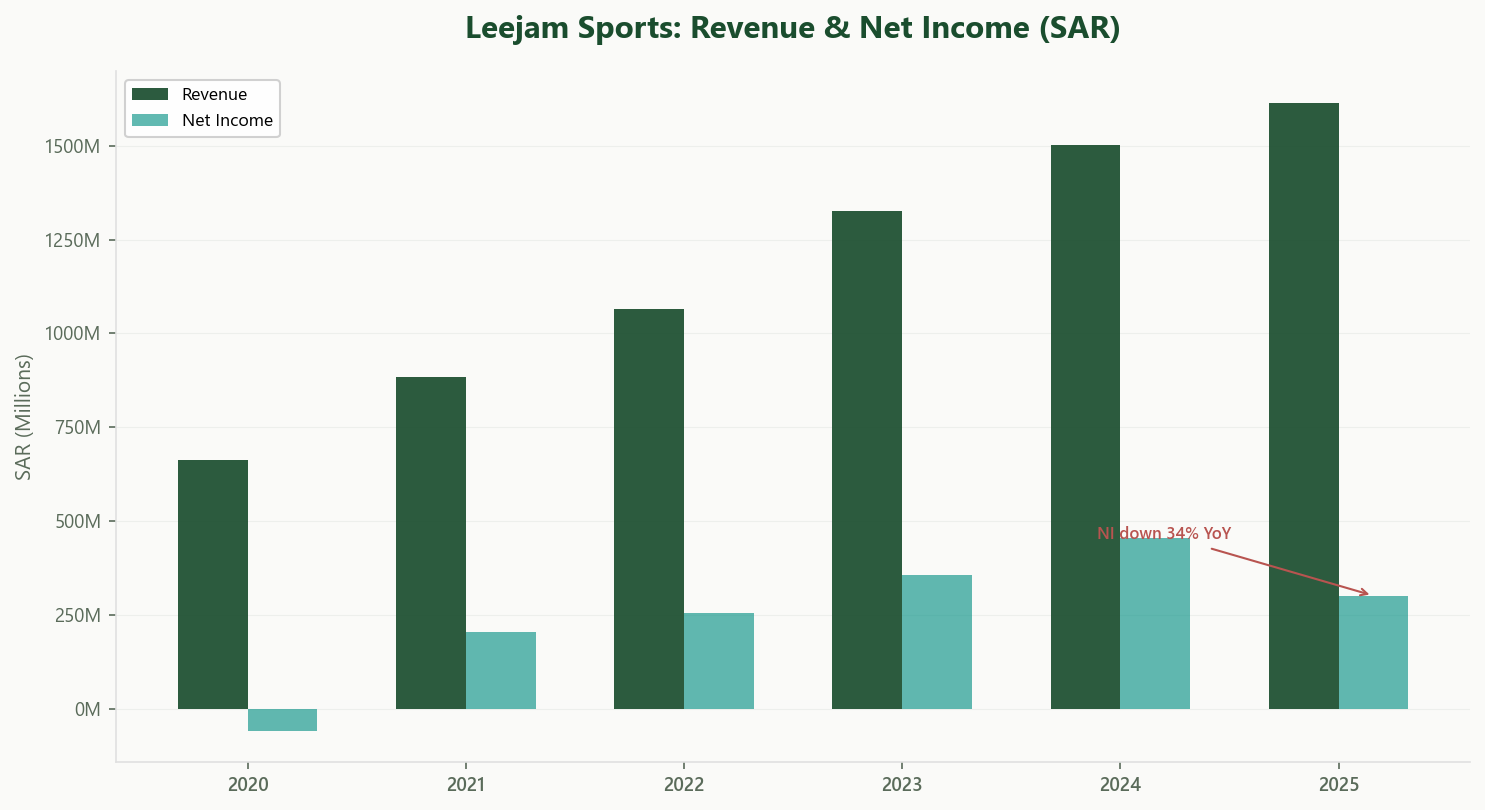
Revenue has grown from SAR 885 million in 2021 to SAR 1.61 billion in 2025, a compound annual growth rate of roughly 16%. This is a post-COVID recovery story. In 2020, Leejam posted a net loss of SAR 59 million as gym closures wiped out the business model temporarily.
The recovery was swift. By 2023, revenue reached SAR 1.33 billion and net income hit SAR 356 million, the highest in the company’s history at the time. In 2024, net income climbed further to SAR 456 million, supported by 13% revenue growth and strong operating leverage as fixed costs were spread across a larger center base.
Then came 2025. Revenue grew 7.5% to SAR 1.61 billion, but net income dropped 34% to SAR 302 million.
Where did the profits go? Three places. First, depreciation surged to SAR 337 million (up from SAR 294 million), reflecting the wave of new center openings hitting the income statement. Second, finance costs rose to SAR 109 million as the company took on additional debt to fund expansion. Third, the company recorded impairments on Sports Hub Sports Company (SAR 3.2 million) and on an investment in Integrated Medical Care Services (SAR 9.6 million). These were partially offset by SAR 11.5 million in reversals of prior fitness-center impairments, but the net effect, combined with a SAR 770 thousand write-off of pre-construction work, still weighed on the bottom line.
EBIT dropped from SAR 447 million to SAR 423 million despite the revenue uplift. The operating margin compressed from 29.8% to 26.2%. The expansion is feeding the top line but squeezing the bottom line.
Profitability & Value Creation
Despite the 2025 earnings dip, Leejam's capital efficiency remains solid.
Return on Invested Capital (ROIC) stands at approximately 15.7%, against an estimated WACC in the 7 to 9% range. That is a value creation spread of roughly 7 to 8 percentage points. Not as wide as the best consumer businesses on Tadawul, but firmly positive.
The operating margin of 26.2% is healthy for a services business with high fixed costs. EBITDA reached SAR 760 million (operating profit plus SAR 337 million in depreciation), giving an EBITDA margin of 47%. The subscription model provides strong cash flow visibility, with members paying monthly or annual fees in advance.
On the governance side, SAR 3.4 million in lease rentals were paid to a major shareholder, Hamad Ali AlSagri. Another SAR 3.2 million went to shareholder affiliates for furniture and supplies. The board approved these transactions. Individually modest, but worth monitoring as an ongoing pattern of shareholder-linked payments.
Cash Flow & Balance Sheet
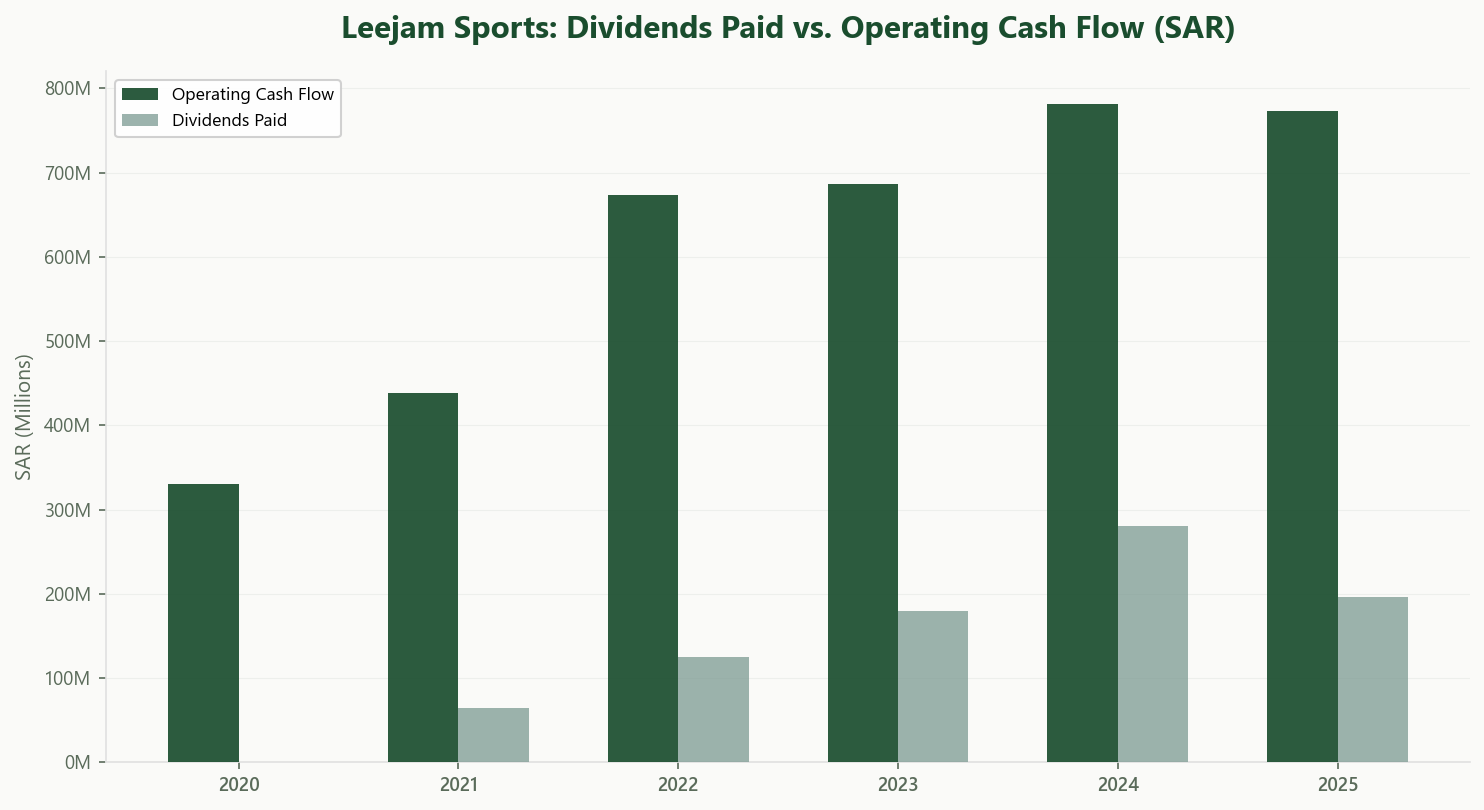
Operating cash flow has been strong and consistent: SAR 438 million in 2021, SAR 669 million in 2022, SAR 686 million in 2023, SAR 781 million in 2024, and SAR 773 million in 2025.
The real story is where the cash goes. Capital expenditure has been aggressive: SAR 371 million in 2025, and a remarkable SAR 584 million in 2024. Over five years, Leejam has spent SAR 1.67 billion on property and equipment, building out the Fitness Time network. OCF covers dividends comfortably, but very little is left over after capex.
Dividends have grown from SAR 64 million in 2021 to SAR 282 million in 2024, before dropping to SAR 197 million in 2025. The company also repurchased SAR 138 million in shares during 2025. Combined shareholder returns of SAR 335 million consumed 43% of operating cash flow.
The balance sheet tells the leverage story. Total debt (bank loans) stands at SAR 548 million. But the real obligation is lease liabilities: SAR 1.48 billion (SAR 117 million current, SAR 1.37 billion non-current). Combined debt and leases total SAR 2.03 billion, against equity of SAR 1.20 billion. That is a gearing ratio of 1.69x.
Cash on hand at year-end was SAR 170 million. The company also carries a legacy SAR 32.7 million zakat liability related to former overseas shareholding structures. A former shareholder has provided an indemnity to cover this amount, and a formal reimbursement agreement was finalized after year-end.
Valuation & What It Implies
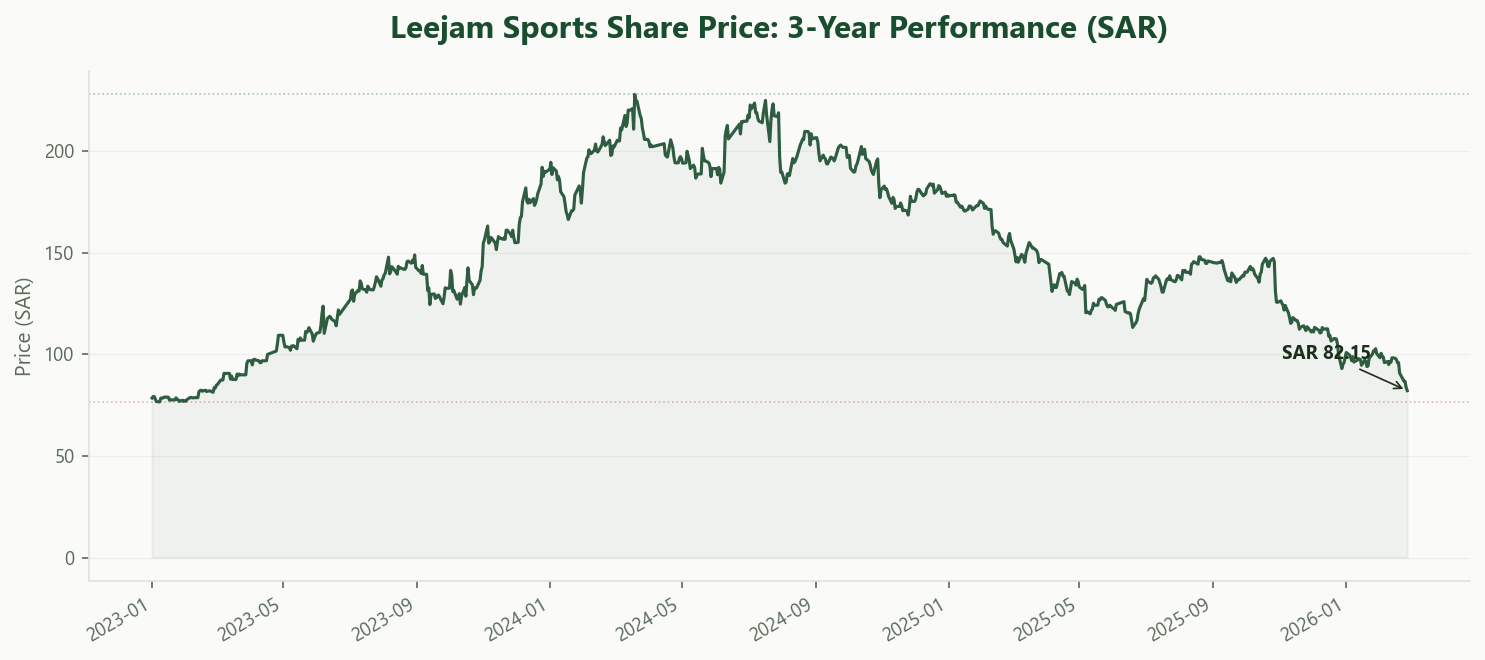
At the recent share price of SAR 82.15:
With roughly 52 million shares outstanding, the market capitalization is approximately SAR 4.3 billion. On trailing 2025 net income of SAR 302 million, the P/E is about 14.2x. Among Consumer Services peers on Tadawul, that is on the cheaper end: Jahez trades at 13.7x, Alamar at 20x, Ataa at 28x, and NCLE at 32x. Leejam is not being priced as an expensive growth story, at least not on a headline P/E basis.
Enterprise value, however, tells a different story. Adding SAR 2.03 billion in total debt and lease liabilities and netting out SAR 170 million in cash gives an EV of roughly SAR 6.1 billion. Against EBITDA of SAR 760 million, the implied EV/EBITDA is about 8.1x. That is among the cheapest in the sector: only Alamar trades lower at 6.7x, while Jahez (10x), Almasar (12.7x), and Ataa (15.1x) all command higher multiples. The relatively low EV/EBITDA reflects both the strong EBITDA generation and the market’s awareness of the lease-heavy balance sheet.
The bull case: Leejam is the dominant fitness brand in a country with a young, increasingly health-conscious population and explicit government promotion of active lifestyles under Vision 2030. New centers, once mature, should contribute incremental margins as depreciation flattens. The dividend yield of roughly 4.6% provides some income while waiting.
The bear case: the company is in a capital-intensive land grab. Lease obligations of SAR 1.48 billion are long-duration and largely non-cancellable. If membership growth slows or the macro environment tightens consumer discretionary spending, the fixed-cost base becomes a drag. The 2025 results already show what happens when expansion costs outpace revenue growth.
Takeaway
Leejam Sports has built the dominant fitness platform in Saudi Arabia. The post-COVID revenue recovery has been exceptional, and the subscription-based model generates strong, predictable cash flow. A ROIC of 15.7% against an estimated WACC of 7 to 9% means the business earns meaningfully above what its capital costs, a bar that many listed companies fail to clear.
The 2025 report shows the cost side of rapid expansion. Depreciation, finance costs, and impairments absorbed the revenue gains, leaving net income well below 2024 levels. The SAR 1.48 billion in lease liabilities is the single largest line item on the balance sheet and the most important variable for risk. Related-party transactions are disclosed and individually modest, but the pattern of shareholder-linked payments is worth monitoring.
Whether this is a high-growth compounder or an over-levered expansion play depends on how quickly new centers mature and whether the Saudi fitness market is deep enough to absorb the capacity being built.
Explore Leejam's Full Profile
Usool Research tracks Leejam's financials, governance disclosures, valuation metrics, and more. Structured and updated from every filing.
Sign up free and explore the data.
Start Exploring →Look for value. Cut through the noise.
Disclaimer: This article is for informational and educational purposes only. It does not constitute investment advice, a recommendation, or a solicitation to buy or sell any securities. The author and Usool Research may hold positions in securities discussed. Usool Research is not a licensed investment advisor. All data sourced from publicly available filings and the Usool Research platform.