Jamjoom Pharma Annual Report 2025:
Strong Growth, Concentrated Distribution
Jamjoom Pharma manufactures pharmaceuticals and consumer health products across the MENA region. Revenue grew 14% to SAR 1.50 billion in 2025, net income reached SAR 464 million, and the company generated SAR 406 million in operating cash flow. A net cash balance sheet and ROIC above 20% paint a strong financial picture. But over half of all revenue flows through a single affiliated distributor. A closer look at the numbers, the governance structure, and what the market is pricing in.
What Does Jamjoom Pharma Do?
Jamjoom Pharmaceuticals Factory Co. (Tadawul: 4015) is a Saudi joint-stock company engaged in the manufacture and sale of human medicines, nutraceuticals, antibiotics, and treatments spanning respiratory, cardiovascular, and oncology categories. The Group operates manufacturing facilities in Saudi Arabia and Egypt, with a 49%-owned joint venture in Algeria (Jamjoom Algeria Lil Dawa).
Revenue comes from two segments: Pharmaceutical Products (SAR 1.28 billion, 86% of revenue) and Consumer Health Products (SAR 217 million, 14%). Geographically, Saudi Arabia accounts for 66% of revenue, with the Gulf region contributing 13%, Iraq 9%, Egypt 5%, and North Africa and other export markets 7%.
The company has 70 million shares outstanding. The majority shareholder is Yousef Mohammed Salah Jamjoom with a 41.65% stake. The Group is subject to zakat at the parent level and income tax at its foreign subsidiaries.
Revenue & Earnings
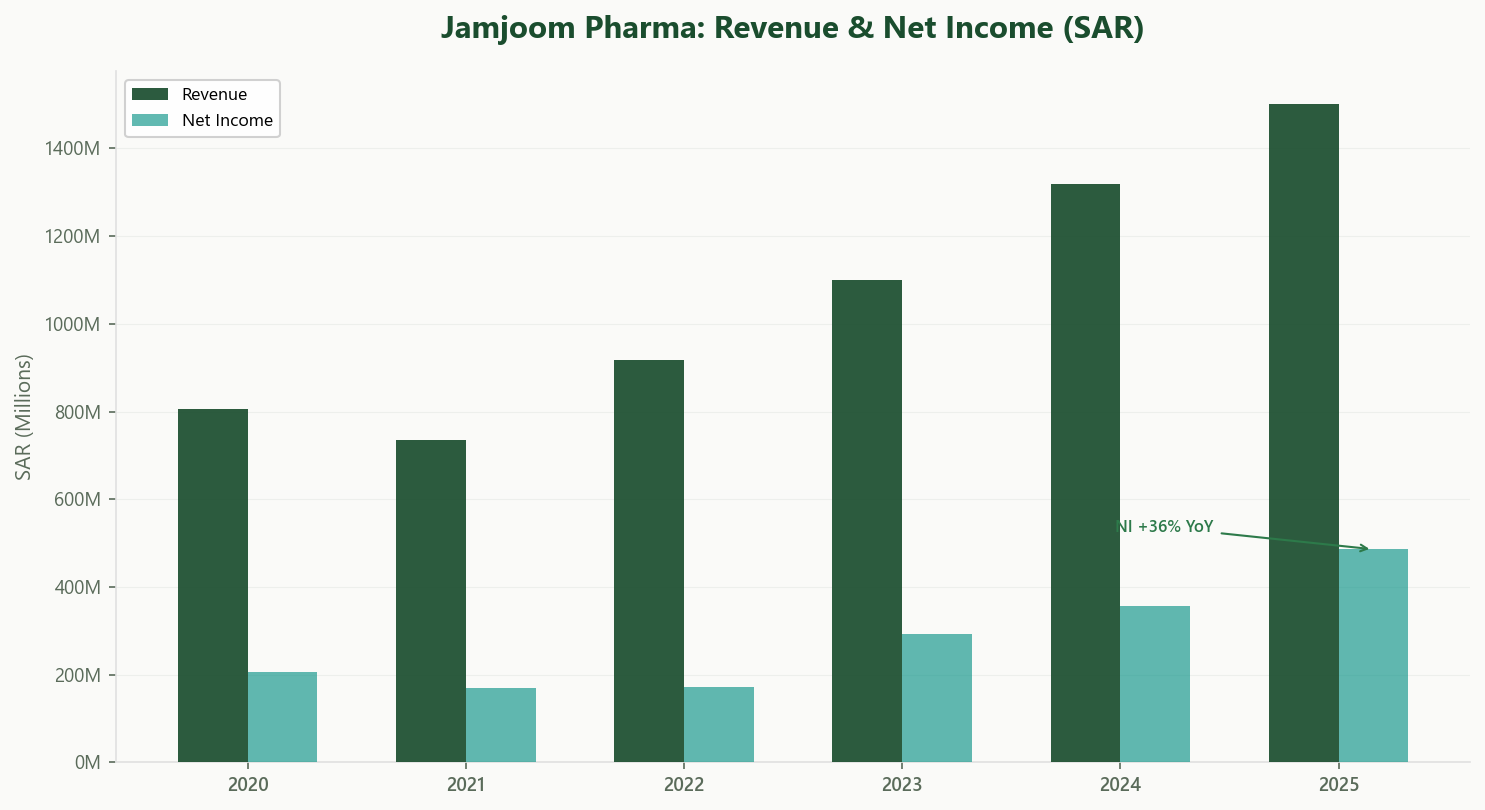
Revenue has doubled over four years: SAR 736 million in 2021, SAR 917 million in 2022, SAR 1.10 billion in 2023, SAR 1.32 billion in 2024, and SAR 1.50 billion in 2025. That is a four-year CAGR of approximately 19%. The 2025 growth of 14% was driven by both segments: pharmaceutical revenue rose 13% to SAR 1.28 billion and consumer health grew 21% to SAR 217 million.
Net income followed an even steeper trajectory. Earnings were flat at SAR 171 million in both 2021 and 2022, then accelerated: SAR 292 million in 2023, SAR 357 million in 2024, and SAR 464 million in 2025, a 30% increase year-over-year. EPS rose from SAR 5.09 to SAR 6.63.
EBIT climbed from SAR 381 million to SAR 475 million. The operating margin expanded from 28.9% to 31.6%. Finance costs dropped sharply from SAR 24 million in 2024 to SAR 1.1 million in 2025, reflecting the full paydown of borrowings inherited from the pre-IPO capital structure.
Non-recurring items were immaterial. A SAR 1.2 million FX gain in 2025 versus a SAR 18.8 million FX loss and a SAR 5.8 million impairment provision on a related-party receivable in 2024. The year-over-year earnings improvement is largely organic.
Profitability & Value Creation
ROIC stands at approximately 20%, against an estimated WACC in the 7 to 9% range. That implies a value creation spread of roughly 11 to 13 percentage points. For a pharmaceutical manufacturer, this is a strong result.
The business is capital-efficient but not capital-light. Capex was SAR 61 million in 2025 (SAR 53 million in PP&E and SAR 8 million in intangibles), reflecting ongoing investment in manufacturing capacity. Depreciation and amortization of SAR 44 million covers roughly 72% of capex, meaning the company is investing incrementally in growth capacity.
At the segment level, the Pharmaceutical segment generated SAR 808 million in gross profit on SAR 1.28 billion revenue (63% margin), while Consumer Health contributed SAR 131 million on SAR 217 million (60%). Both segments improved margins year-over-year.
Governance warrants close attention. SAR 831 million in product sales, approximately 55% of consolidated revenue, was routed through Jamjoom Medicine Store, an affiliated entity. This is the single largest related-party dynamic in the filing. Additionally, the Group provided SAR 78 million in corporate guarantees to banks in Algeria supporting its joint venture, and maintains an interest-free loan of SAR 17.5 million to a fully impaired joint venture (Jamjoom HUPP Pharma). Procurement from affiliates totaled SAR 35 million, split between a travel agency (SAR 23 million) and a packing materials supplier (SAR 12 million). Transactions are disclosed at "mutually agreed prices." The pattern of revenue and procurement concentration through family-affiliated entities is worth monitoring.
Cash Flow & Balance Sheet
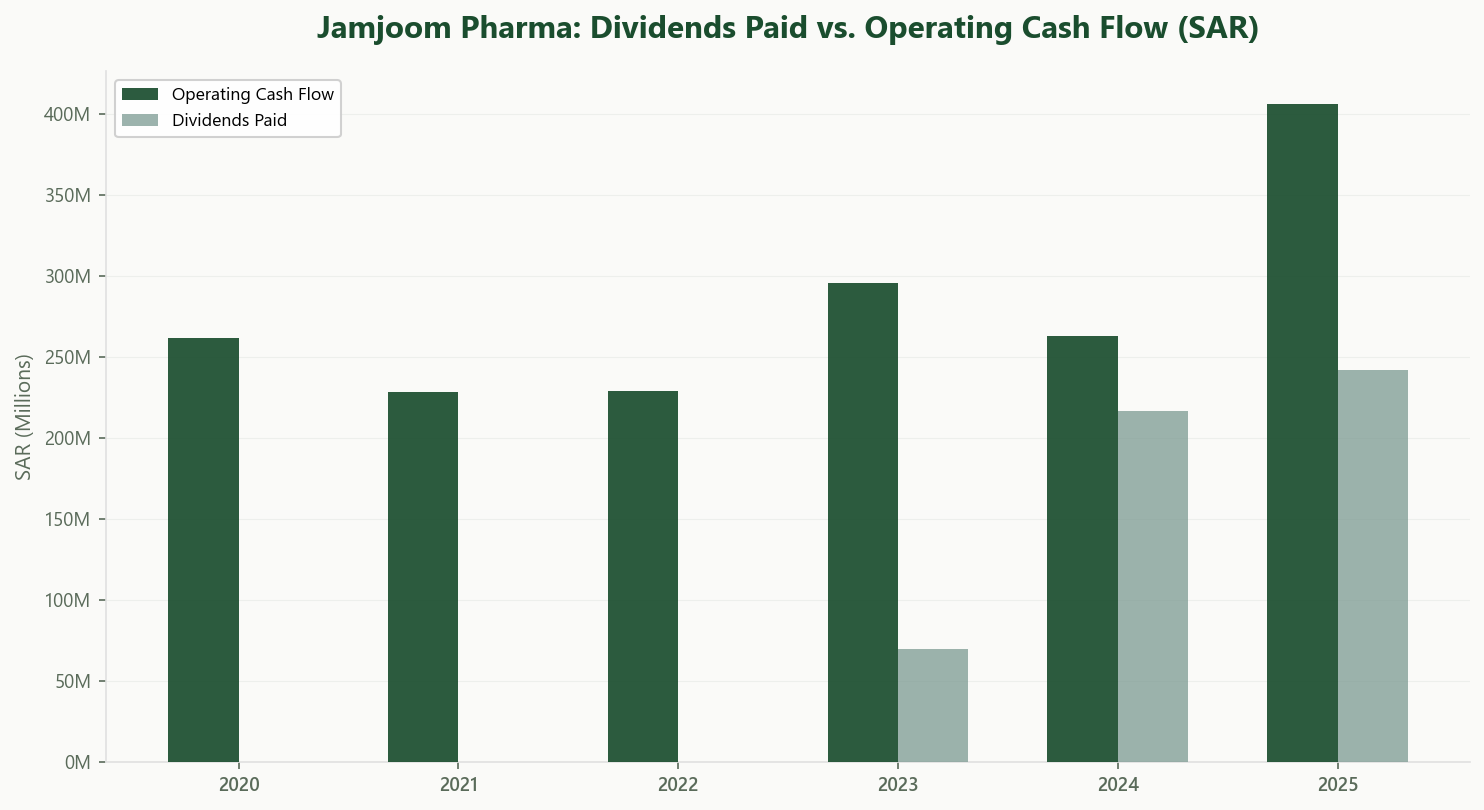
Operating cash flow reached SAR 406 million in 2025, a significant step up from SAR 263 million in 2024 and SAR 296 million in 2023. The improvement was driven by higher earnings and strong cash conversion despite a SAR 143 million increase in receivables (from SAR 444 million to SAR 586 million).
After capex, free cash flow was approximately SAR 345 million.
Dividends totaled SAR 242 million in 2025 (SAR 3.46 per share), up from SAR 217 million in 2024 and SAR 70 million in 2023. The payout ratio of 52% of net income is moderate, and well covered by operating cash flow at 60%. The sharp increase from 2023 reflects the normalization of dividend policy post-IPO.
The balance sheet is clean. Cash and equivalents of SAR 358 million against total lease liabilities of SAR 16 million. There is no bank borrowing. Long-term accounts payable of SAR 91 million is the only other meaningful liability beyond trade payables. Total shareholder equity stands at SAR 1.72 billion. Receivables at SAR 586 million (29% of total assets) are the largest single asset, followed by cash and inventory (SAR 248 million).
The Group's two largest customers accounted for 65.8% of revenue in 2025, underscoring the concentration risk on the distribution side.
Valuation & What It Implies
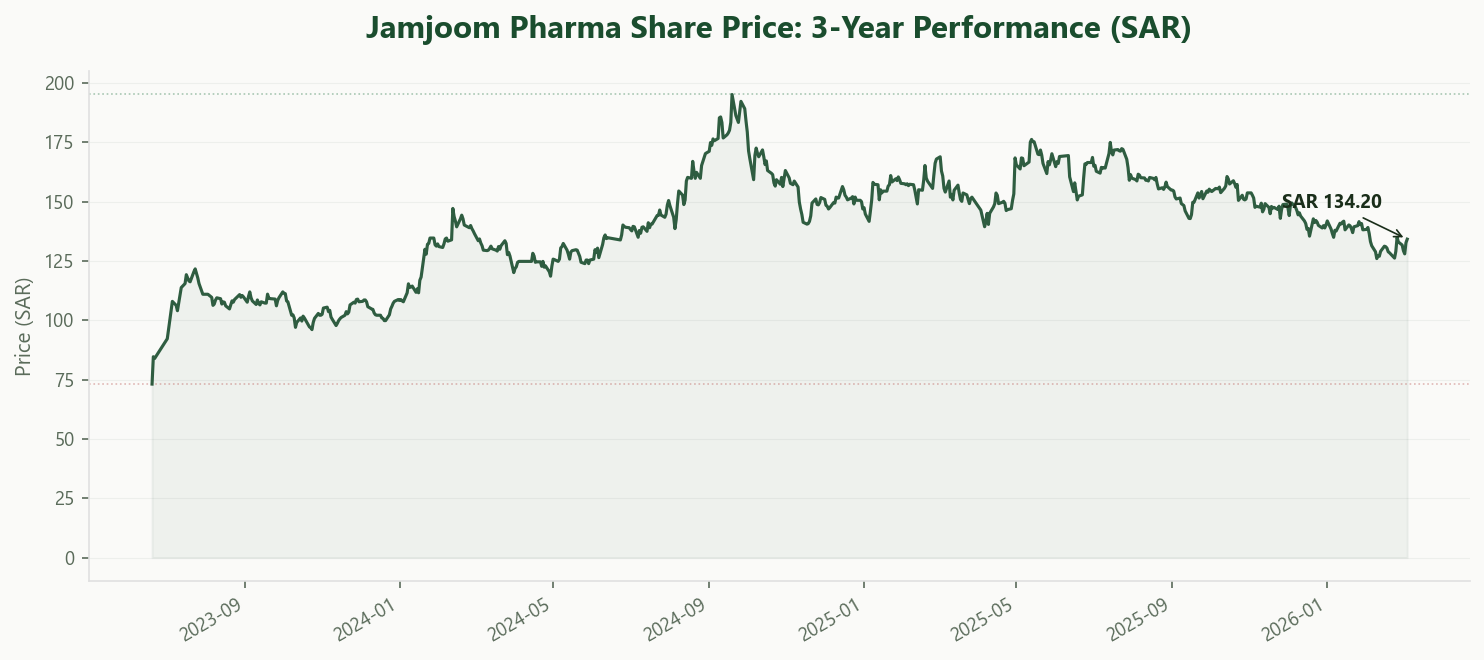
At the recent share price of SAR 135.60:
With 70 million shares outstanding, the market capitalization is approximately SAR 9.5 billion. On trailing 2025 net income of SAR 464 million, the P/E is about 20x. For a pharmaceutical company compounding revenue at 19% annually with ROIC above 20% and a net cash balance sheet, that is not unreasonable, though it leaves limited room for disappointment.
Enterprise value, adding SAR 16 million in lease liabilities and SAR 91 million in long-term payables and subtracting SAR 358 million in cash, is approximately SAR 9.2 billion. Against EBITDA of SAR 519 million (EBIT of SAR 475 million plus SAR 44 million in depreciation), the EV/EBITDA is about 17.8x. Among Tadawul pharma and healthcare peers, this sits at the upper end but is supported by superior margins and growth.
The bull case: the company has a proven track record of double-digit organic growth, expanding margins, no debt, and a large addressable market across MENA. If the pharma segment sustains its growth rate and the consumer health division scales further, earnings can compound in the high-teens for several more years.
The bear case: over half of revenue depends on an affiliated distributor, creating concentration risk if terms change. Receivables are large and growing. The Egyptian operations carry currency risk, and the impaired Algerian JV raises questions about international expansion discipline. At 20x earnings, any growth deceleration would compress the multiple.
Takeaway
Jamjoom Pharma is a high-quality pharmaceutical manufacturer delivering 19% revenue CAGR, 31.6% operating margins, ROIC near 20%, and OCF of SAR 406 million on a debt-free balance sheet. The business is scaling and generating surplus capital.
The concentration of distribution through an affiliated entity, with 55% of revenue flowing through Jamjoom Medicine Store, is the most significant governance dynamic. Combined with SAR 78 million in guarantees for the Algerian JV and SAR 35 million in procurement from family-affiliated suppliers, the pattern is worth monitoring as the company scales.
At 20x trailing earnings and roughly 18x EV/EBITDA, the market is paying a growth premium. Whether the company can sustain high-teen growth while diversifying its distribution channels will determine if that premium is justified.
Explore Jamjoom Pharma's Full Profile
Usool Research tracks Jamjoom Pharma's financials, governance disclosures, valuation metrics, and more. Structured and updated from every filing.
Sign up free and explore the data.
Start Exploring →Look for value. Cut through the noise.
Disclaimer: This article is for informational and educational purposes only. It does not constitute investment advice, a recommendation, or a solicitation to buy or sell any securities. The author and Usool Research may hold positions in securities discussed. Usool Research is not a licensed investment advisor. All data sourced from publicly available filings and the Usool Research platform.